Like the blind men and the elephant, the competing charges on Georgia’s jobless are because of different data.
By E. Frank Stephenson

Georgians with the misfortune of turning on their televisions confront a barrage of conflicting ads about the state’s labor market. One side would have Georgians believe that labor market conditions are peachy; the other would have us believe the job market is the pits.
Nor are Georgians reading their newspapers immune from the mudslinging. A local columnist recently asked breathlessly, “What has caused our great state to lose more jobs than all other states to the result we now trail all other states in job growth?” He added, “There has not been a time in the history of the state when the job report has been worse, save that of the Great Depression.”
No doubt the dueling ads are part of the normal hurly-burly of politics; politicians trying to differentiate themselves would use some other issue ad if not bickering about Georgia’s labor market. But, like the blind men and the elephant, the competing charges are partly because the Bureau of Labor Statistics reports employment data from two different surveys: a household survey, the Current Population Survey, and an establishment survey, the Current Employment Statistics program.
The household survey involves interviews of about 60,000 households around the country; the establishment survey uses data from 144,000 businesses and government agencies, representing about 554,000 individual worksites.
 The surveys often give similar indications about labor market conditions but, not surprisingly, they sometimes diverge because they are administered differently. For example, the household survey should do a better job of picking up self-employed people because they are not on an established firm’s payroll. It can also gather information about those who are not working but would like to have jobs, hence it is used to calculate the unemployment rate.
On the other hand, the establishment survey yields better sectoral data about employment (e.g., manufacturing or health care) because it is obtaining data from employers. It should also be less susceptible to random variation because it is based on a much larger sample size.
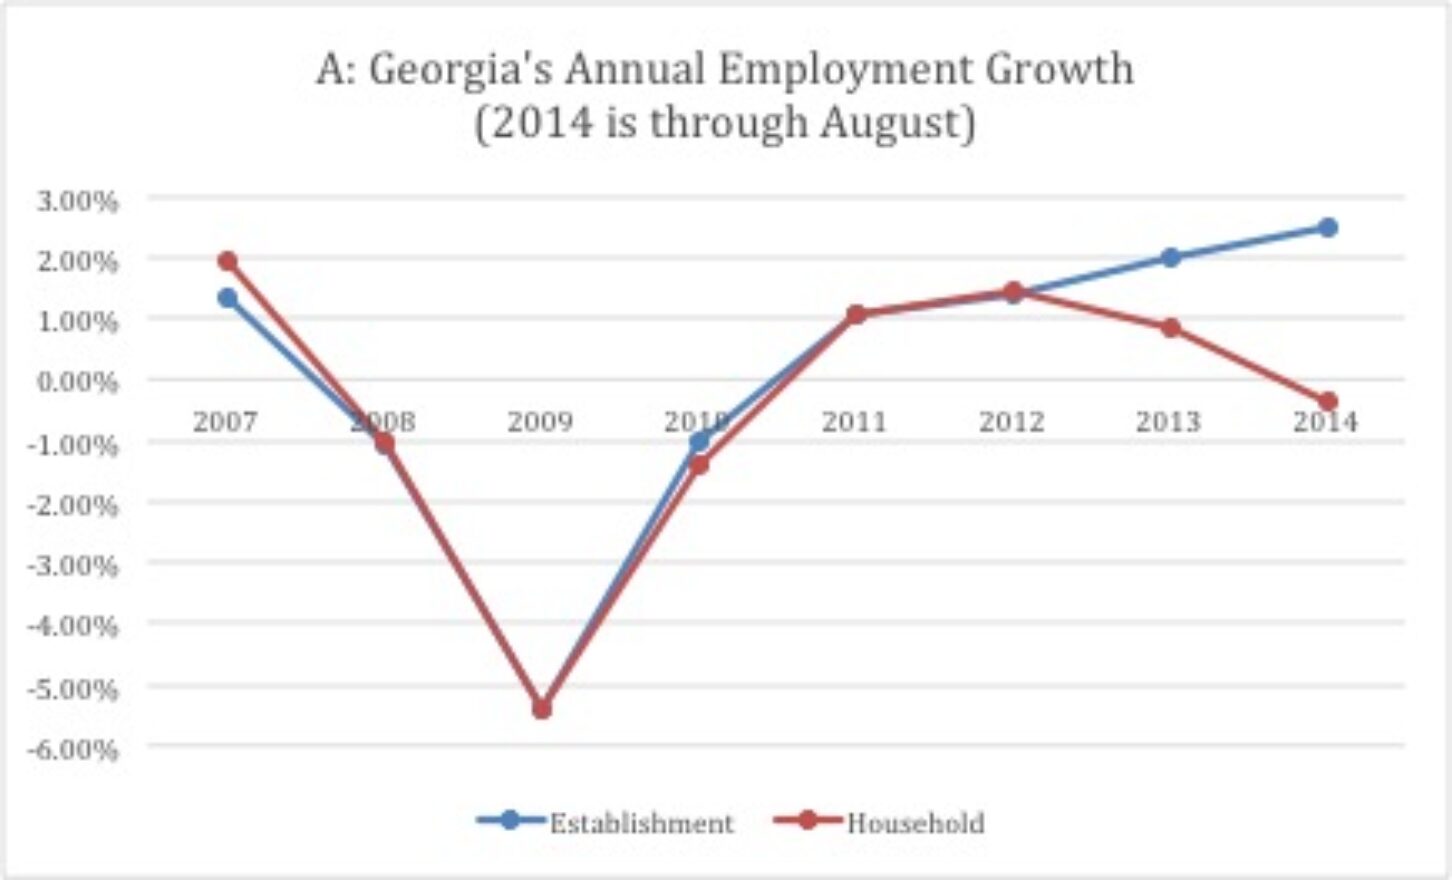
With that in mind, consider Georgia’s labor market performance. In Chart A, Georgia’s annual job growth measured using both household and establishment survey data shows nearly identical movement between 2007 and 2012. The series diverge, however, for 2013 and 2014. The establishment survey shows Georgia’s job growth accelerating to about 2.5 percent in 2014. By contrast, the household survey shows Georgia’s employment falling by 0.37 percent between 2013 and August of this year. It is worth noting that the slight decline seen in Georgia over the past year in the household survey is smaller than the losses in nearby states of Alabama (-1.0 percent), Kentucky (-0.9 percent), Mississippi (-2.1 percent), and Tennessee (-1.1 percent).
 What are we to make of the household and establishment surveys giving different indications of job growth? Chart B, depicting Georgia’s monthly initial unemployment claims since 2006 can shed some light on which employment series is more likely to be correct. Although new unemployment claims show seasonal spikes in January and (to a lesser extent) in the summer each year, there is a clear downward trend since 2009. In fact, recent months show initial jobless claims falling below the pre-recession levels of 2006 and 2007.
That the downward trend in new unemployment claims beginning in 2009 continues through 2014 suggests the establishment survey’s indication of unbroken job growth is more likely to be correct. If, instead, the household survey’s decline in employment growth in 2013 and decline in actual employment in 2014 is correct, then we would not expect to see the downward trend in new jobless claims continue. Of course, if our hyperbolic columnist’s proclamation of Great Depression-like labor market conditions is correct, we would see an uptick in new jobless claims that would dwarf even the sharp increase in late 2008.
The bottom line is fairly simple. Georgia’s job market is not booming – look to the shale-fueled growth of North Dakota and Texas for boom states – but that is no surprise: Georgia’s construction sector and housing-related manufacturing (think Dalton) are still struggling to recover from the housing crisis. While faster job creation would certainly be welcome, exaggerated claims of Great Depression-like labor market conditions are simply baseless. Fortunately, campaign season is almost over. For now.
E. Frank Stephenson is a Senior Fellow with the Georgia Public Policy Foundation and Professor of Economics at Berry College.
By E. Frank Stephenson
E. Frank Stephenson
Georgians with the misfortune of turning on their televisions confront a barrage of conflicting ads about the state’s labor market. One side would have Georgians believe that labor market conditions are peachy; the other would have us believe the job market is the pits.
Nor are Georgians reading their newspapers immune from the mudslinging. A local columnist recently asked breathlessly, “What has caused our great state to lose more jobs than all other states to the result we now trail all other states in job growth?” He added, “There has not been a time in the history of the state when the job report has been worse, save that of the Great Depression.”
No doubt the dueling ads are part of the normal hurly-burly of politics; politicians trying to differentiate themselves would use some other issue ad if not bickering about Georgia’s labor market. But, like the blind men and the elephant, the competing charges are partly because the Bureau of Labor Statistics reports employment data from two different surveys: a household survey, the Current Population Survey, and an establishment survey, the Current Employment Statistics program.
The household survey involves interviews of about 60,000 households around the country; the establishment survey uses data from 144,000 businesses and government agencies, representing about 554,000 individual worksites.
The surveys often give similar indications about labor market conditions but, not surprisingly, they sometimes diverge because they are administered differently. For example, the household survey should do a better job of picking up self-employed people because they are not on an established firm’s payroll. It can also gather information about those who are not working but would like to have jobs, hence it is used to calculate the unemployment rate.
On the other hand, the establishment survey yields better sectoral data about employment (e.g., manufacturing or health care) because it is obtaining data from employers. It should also be less susceptible to random variation because it is based on a much larger sample size.
With that in mind, consider Georgia’s labor market performance. In Chart A, Georgia’s annual job growth measured using both household and establishment survey data shows nearly identical movement between 2007 and 2012. The series diverge, however, for 2013 and 2014. The establishment survey shows Georgia’s job growth accelerating to about 2.5 percent in 2014. By contrast, the household survey shows Georgia’s employment falling by 0.37 percent between 2013 and August of this year. It is worth noting that the slight decline seen in Georgia over the past year in the household survey is smaller than the losses in nearby states of Alabama (-1.0 percent), Kentucky (-0.9 percent), Mississippi (-2.1 percent), and Tennessee (-1.1 percent).
What are we to make of the household and establishment surveys giving different indications of job growth? Chart B, depicting Georgia’s monthly initial unemployment claims since 2006 can shed some light on which employment series is more likely to be correct. Although new unemployment claims show seasonal spikes in January and (to a lesser extent) in the summer each year, there is a clear downward trend since 2009. In fact, recent months show initial jobless claims falling below the pre-recession levels of 2006 and 2007.
That the downward trend in new unemployment claims beginning in 2009 continues through 2014 suggests the establishment survey’s indication of unbroken job growth is more likely to be correct. If, instead, the household survey’s decline in employment growth in 2013 and decline in actual employment in 2014 is correct, then we would not expect to see the downward trend in new jobless claims continue. Of course, if our hyperbolic columnist’s proclamation of Great Depression-like labor market conditions is correct, we would see an uptick in new jobless claims that would dwarf even the sharp increase in late 2008.
The bottom line is fairly simple. Georgia’s job market is not booming – look to the shale-fueled growth of North Dakota and Texas for boom states – but that is no surprise: Georgia’s construction sector and housing-related manufacturing (think Dalton) are still struggling to recover from the housing crisis. While faster job creation would certainly be welcome, exaggerated claims of Great Depression-like labor market conditions are simply baseless. Fortunately, campaign season is almost over. For now.
E. Frank Stephenson is a Senior Fellow with the Georgia Public Policy Foundation and Professor of Economics at Berry College.