Amid fears of global warming and extreme temperatures, tropical storms, air pollution and so on, data suggest record high temperatures are nothing new.
By Harold Brown

The dog days of summer are upon us and, with them, the stoked-up fears of global warming and the extremes that predicted: higher temperatures, more tropical storms, more hotter days, more heatstroke, more air pollution, and so on.
More often than not, however, the trend in extremes is the opposite of the narrative.
This is especially true for high temperatures. Extreme temperatures are recorded and expressed in a number of ways, including yearly, monthly and daily highs, as well as all-time records. The number of days exceeding such limits as 90, 95 or 100 degrees are also counted and considered a measure of warming. Extreme temperatures are reported for individual monitoring stations, regions, states and the nation. Because they are often reported without specifying the historical span of the station, however, they may misrepresent the long-term trend.
At the national level, the all-time record-high temperatures for each state listed on the National Oceanic and Atmospheric Administration (NOAA) website illustrate the lack of expected trends. The collective number of high-temperature records for the 50 states since the 1880s totals 62. This is more than the number of states; some states have the same high repeated in one year or in different years. For example, Oklahoma’s highest temperature (120 degrees) occurred four times in July and August of 1936.

Of the 62 record high temperatures listed from 1895 to 2018, more than two thirds (43) occurred before 1950; just two were after 2000.
But weather, like politics, is local, and extreme temperature trends vary for locations. When temperatures reach the 100-degree mark, especially in Northern states, weather reports and citizens consider the weather “extreme.”
Yet 100-degree temperatures in Northern states have not become more frequent. Minnesota’s Twin Cities experienced 23 days above 100 degrees in the past 63 years; in the 63 years before that, it had 48. In New York’s Central Park, the three decades of the 1930s through the 1950s had 28 days of 100 degrees or higher; the past six decades had 23.
Georgia is no stranger to extreme heat. The U.S. Department of Agriculture’s Weather Bureau report of 1914 noted:
Probably the most severe heat wave ever experienced in Georgia occurred during the last decade (10 days) in June. From the 20th to the 30th the daily temperatures exceeded 90 degrees throughout the state, and on the 25th, maximum temperatures of 100 degrees and above were registered at every meteorological station in Georgia (57 stations) except Clayton in the extreme northeastern corner of the State. (Parentheses added.)
Extreme heat in Georgia was most frequent in the 1920s and 1930s. The year 1925 was a scorcher: In 17 locations, temperatures reached 108 degrees or higher that summer. All but three of the 66 stations reached 100 degrees at least once; Athens had 38 days above that mark. For comparison, since 2000, Athens has had only one year with more than four days of 100-degree heat: 13 days in 2007.
September was especially hot in 1925; 16 of Athens’ 100 degree-plus days occurred then. Georgia’s average daily maximum that month was 11 above its average September maximum for the 20th century. For Georgia and six other Southeastern states, the month’s heat record was the highest in 124 years.
A NOAA division, Applied Climate Information System, also lists maximum temperature exceedences of 100 degrees for the nation’s weather. Eighteen Georgia stations with continuous records back as far as 1900 saw the average number of 100-degree days per decade decrease by one-half in the second half of the period. (See chart).
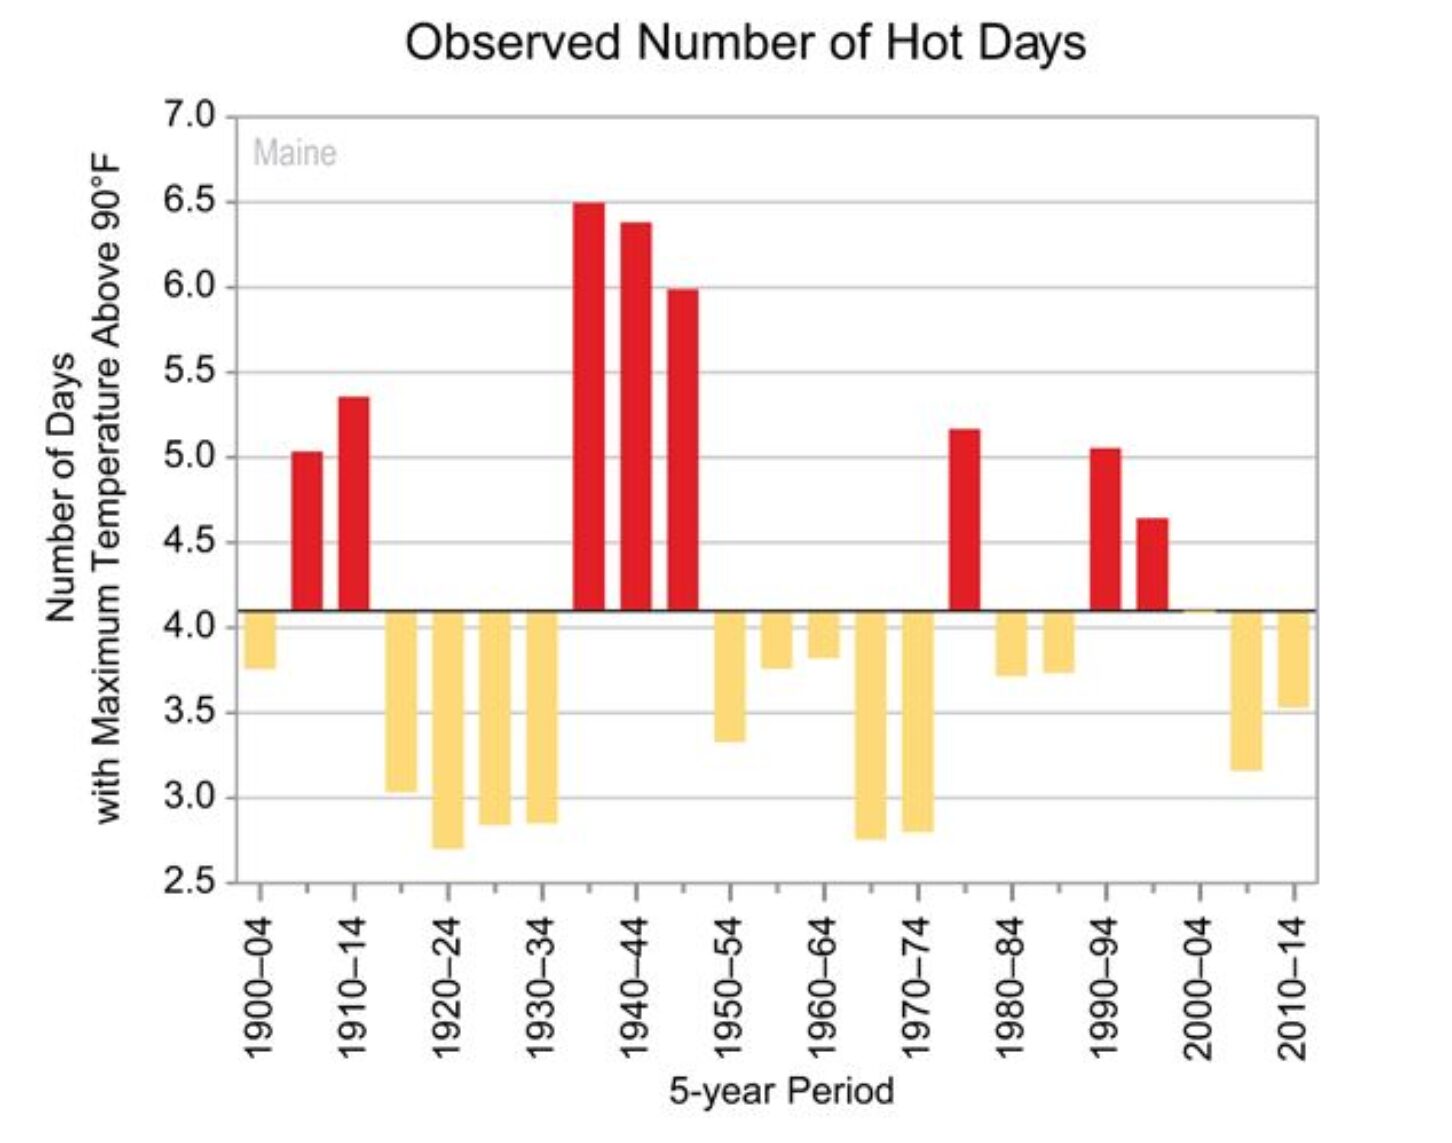
Georgia and other Southeastern states have seen little or no rise in average temperatures (average of the minimums and maximums) in the past 100 years. The NOAA estimates Georgia’s warming at 0.45 degrees per century since 1895. States with much greater estimated warming of average temperatures also experienced fewer hot days. Maine, for example, with estimated warming of 3 degrees since 1900, had only about 40 percent of its hot days (exceeding 90 degrees) after 1960.

in Maine from 1900 to 2014. Source: https://statesummaries.ncics.org/
Whatever warming may have occurred in the United States over the past century must have been mainly due to warmer nights or winter temperatures. Such warming of the cooler parts of the day or year are insignificant, however, when compared with the blistering hot afternoons of yesteryear.
University of Georgia Professor Emeritus Harold Brown is a Senior Fellow with the Georgia Public Policy Foundation and author of “The Greening of Georgia: The Improvement of the Environment in the Twentieth Century.” The Georgia Public Policy Foundation is an independent, nonprofit think tank that proposes market-oriented approaches to public policy to improve the lives of Georgians. Nothing written here is to be construed as necessarily reflecting the views of the Georgia Public Policy Foundation or as an attempt to aid or hinder the passage of any bill before the U.S. Congress or the Georgia Legislature.
© Georgia Public Policy Foundation (July 12, 2019). Permission to reprint in whole or in part is hereby granted, provided the author and his affiliations are cited.